

Transcend: Detecting Concept Drift in Malware Classification Models
Summary of seminar presented by Ali Ayati; based on Jordaney et al. paper; CSCE 689 601 ML-Based Cyber Defenses


The paper describes a state-of-the-art approach to detect concept drift in malware classification models. This blog is originally written for CSCE 689:601 and is the ninth blog of the series: "Machine Learning-Based CyberDefenses".
Paper highlights
The paper explains why malware detection models sometimes get it wrong, mainly due to uncertainties in how they classify data. It emphasizes that probabilities are key in these mistakes. The goal is to find a way to detect concept drift on time (before performance drops rapidly).
Transcend uses a method called non-conformity measure (NCM) during testing to detect how unusual the classifier's predictions are.
The nonconformity measure (NCM) evaluates how "strange" a prediction is according to different possibilities available. High non-conformity means a classifier is unsure.
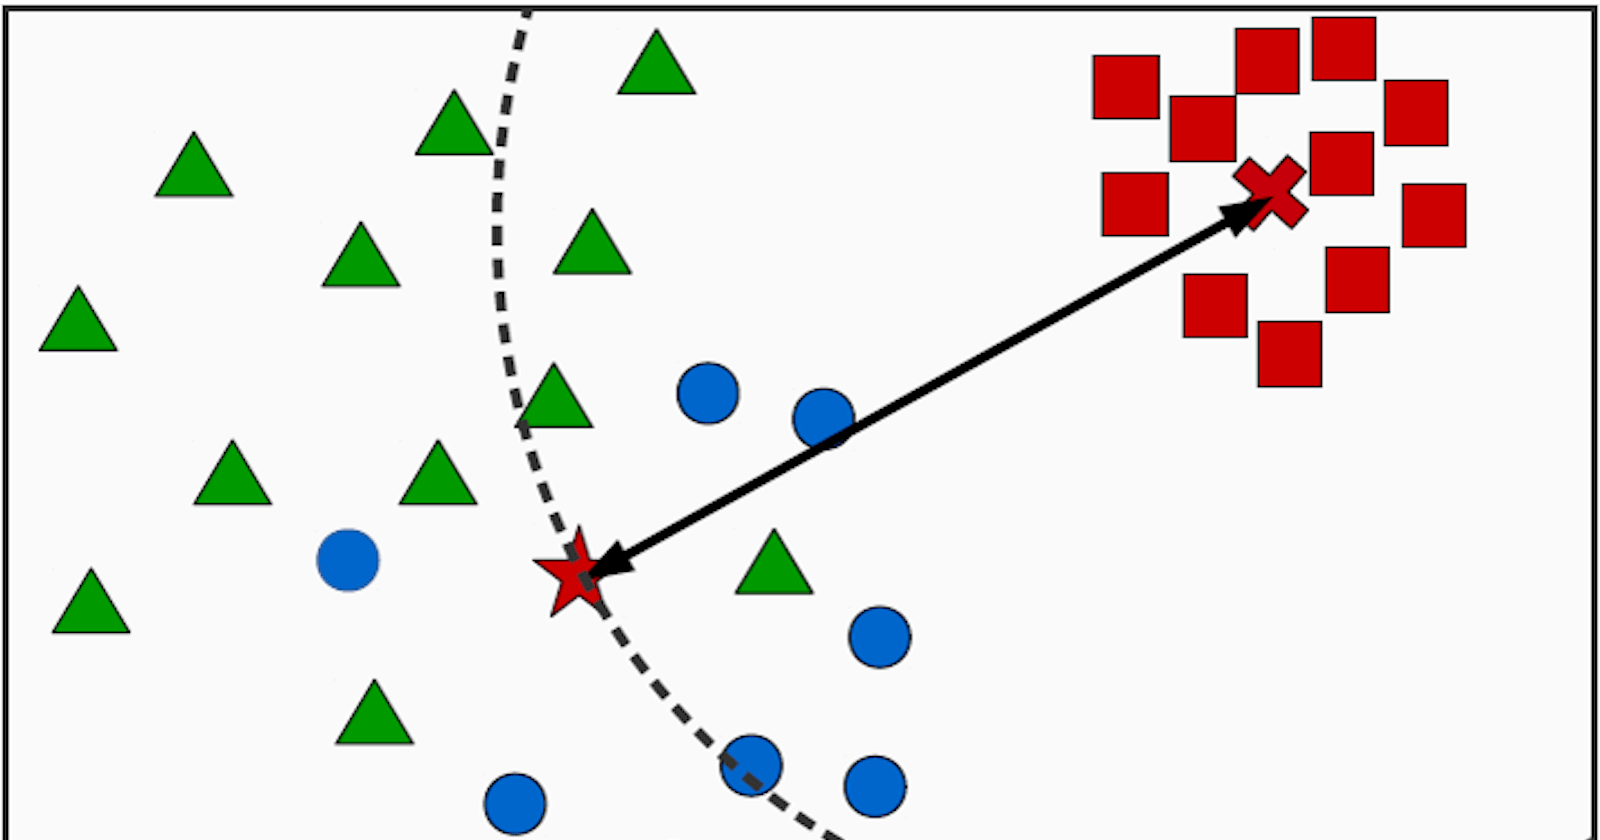
In Support Vector Machines (SVM), NCM can be the distance of a test sample from the decision boundary (hyperplane). So, when samples are near the decision boundary, they have high NCM, indicating uncertainty in the classifier.
In Random Forest models, NCM can be calculated using the proportion of decision trees that classify a sample as malware. So, samples have high NCM if their probabilities are almost equally divided between classes.
The p-value is a number, calculated from a statistical test, that describes how likely we are to have found a particular set of observations if the null hypothesis were true. P values are used in hypothesis testing to help decide whether to reject the null hypothesis.
Transcend operates in three main steps:
It extracts non-conformity measure (NCM) from decision-making algorithm.
It generates p-values for all training samples.
It calculates a per-class threshold to distinguish reliable predictions from unreliable ones.
The difference between a p-value and probability is in their interpretation and use. Probabilities sum up to 1 but p-values don't follow this rule. In Transcend, p-values are used to evaluate the classifier's performance, while probabilities are used for actual classification tasks.
Takeaways
The paper represents the current state-of-the-art research in malware classification models, building upon previous methods while acknowledging areas for enhancement. It signifies a midway point in refining techniques for detecting concept drift in machine learning-based cyber defenses. Ongoing research and fine-tuning are essential to enhance effectiveness and tackle challenges such as scalability.
Difference between statistics and probabilities: statistics depends on the best data that we have; probability is what we expect from future/distribution, infinite predictions.
Coin flip: The probability of getting heads or tails in a fair coin flip is 0.5 for each outcome. If every flip results in heads, the p-value will not be 0.5, it would indicate the likelihood of obtaining this result purely by chance.
Throwing darts on a red spot: Assuming the red spot is a target area, the probability of hitting the red spot reflects the likelihood of hitting the target accurately. The p-value might represent the likelihood of hitting the red spot by random chance, assuming a uniform distribution of dart throws across the target area. If the darts consistently land outside the red spot, a low p-value would indicate that the observed outcomes are unlikely to occur by random chance.
We must not overlook the difference between statistics and probabilities because probabilities always sum up to 1. Initially, with only two classes, any new sample must be allocated to one, suggesting a higher than 50% chance for one class. However, there is a possibility of a new, unseen class (concept drift). So, forcing the classifier to select an existing class without considering the potential for a new one could be problematic.
In network intrusion detection, if a classifier trained to recognize HTTP, SSH, and FTP traffic encounters a new sample that doesn't match any of these categories, a probability-based classifier may mistakenly assign it to an existing class, such as FTP, based on the highest probability. This assumption can lead to misclassifications.
By using statistics, we can check if new data fits with what we already know. Then, probabilities help us decide which class a new sample belongs to based on what we've learned from the data. This approach helps us detect concept drift and adapt our models to changes in the data more effectively.
While probability-based classifiers prioritize assigning samples to existing classes based on likelihood, p-value-based approaches offer a mechanism to acknowledge uncertainty and recognize the need for adapting to new or evolving data patterns. This helps enhance the credibility and adaptability of the classifier in handling unforeseen scenarios.
Classification with rejection is the state-of-the-art. It is a framework aiming to prevent critical misclassification by providing an option not to make a prediction at the expense of the pre-defined rejection cost. Out-of-Distribution (OOD) detection refers to a model's ability to recognize and appropriately handle data that deviates significantly from its training set.
What can go wrong with p-values? By itself, a p value does not provide a good measure of evidence regarding a model or hypothesis. A lone p value is uninformative because it is prone to false positives and says nothing about the magnitude or range of an effect.
| P-Statistics | Probabilities | |
| Basis | Relies on existing data | Reflects expectations or predictions |
| Nature | Historical | Future-oriented |
| Application | Descriptive and inferential | Predictive and prescriptive |
| Scope | Limited to available data | Generalizes to future scenarios |
| Accuracy | Measures the closeness to true value | Reflects the likelihood of future outcomes |
| Precision | Indicates the level of consistency | Predicts the likelihood of specific outcomes |
| Example | Analyzing past sales data to forecast future trends | Predicting the likelihood of rain tomorrow |
What is a null hypothesis? All statistical tests have a null hypothesis. For most tests, the null hypothesis is that there is no relationship between the variables of interest or that there is no difference among groups.
Alternative hypothesis refers to when there is statistical significance between an observed result and the data set it belongs to, meaning that the test rejects a null hypothesis.
A P-Value <=0.05 is considered statistically significant. It denotes strong evidence against the null hypothesis, since there is below 5% probability of the null being correct.
If P-Value < threshold, though the null hypothesis can be rejected, it does not mean that there is 95% probability of alternative hypothesis being true.
A P-Value >0.05 is not statistically significant. It denotes strong evidence for the null hypothesis being true.
References
https://www.usenix.org/conference/usenixsecurity17/technical-sessions/presentation/jordaney
https://www.sciencedirect.com/topics/computer-science/nonconformity-measure
https://www.sciencedirect.com/science/article/pii/S0883944119303818
https://encord.com/blog/what-is-out-of-distribution-ood-detection/
https://www.simplilearn.com/tutorials/statistics-tutorial/p-value-in-statistics-hypothesis
https://www.indeed.com/career-advice/career-development/p-value